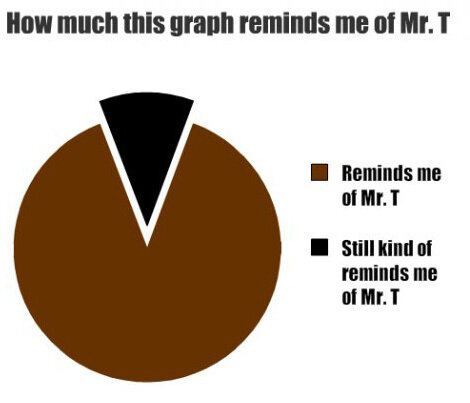
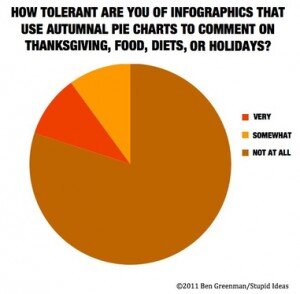
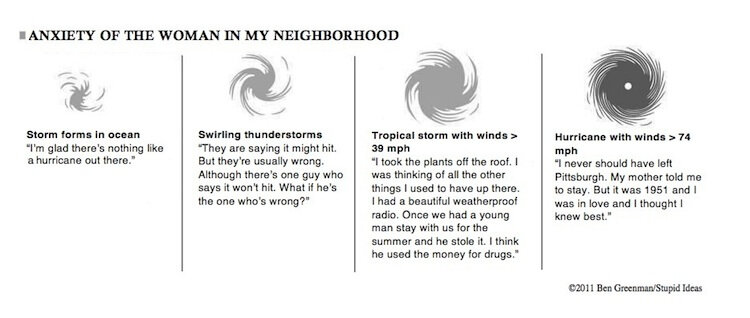
I'm always on the lookout for good infographics. As a "visual learner" and follower of trends in information design, I'm both delighted and bemused by the daily flood of data visualization on the Internet. Often I'm more enamored with the execution than with the content itself, so when I come across a silly "mock" infographic, the joke's on me.Here are some of my favorites:
Ben Greenman's Charts About Graphs and Graphs About Charts
This series on McSweeney's is funny and spot-on. My top picks:


For more funny examples, check out:
McSweeney's Internet Tendency: Ben Greenman's Graphs About Charts and Charts About Graphs
